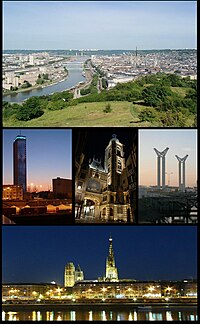
Rouen
Go directly to one of the categories
Culture and Recreation
Demography
Economic Aspects
Environment
Geography
Social Aspects
Training and Education
Travel and Transport
General
Culture and Recreation
Available beds per 1000
2011
: 15.5 no (from
http://epp.eurostat.ec.europa.eu/
)
Number of museum visitors
2010
: 449082 persons (from
http://epp.eurostat.ec.europa.eu/
)
2011
: 235788 persons (from
http://epp.eurostat.ec.europa.eu/
)
2012
: 254881 persons (from
http://epp.eurostat.ec.europa.eu/
)
Public Libraries
2011
: 63 no (from
http://epp.eurostat.ec.europa.eu/
)
2012
: 61 no (from
http://epp.eurostat.ec.europa.eu/
)
Public Swimming Pools
2011
: 22 no (from
http://epp.eurostat.ec.europa.eu/
)
Theatres
2011
: 12 no (from
http://epp.eurostat.ec.europa.eu/
)
Tourist Bed-Places
2011
: 7571 no (from
http://epp.eurostat.ec.europa.eu/
)
2012
: 7598 no (from
http://epp.eurostat.ec.europa.eu/
)
Tourist Nights Spent
2011
: 1010649 no (from
http://epp.eurostat.ec.europa.eu/
)
2012
: 1002769 no (from
http://epp.eurostat.ec.europa.eu/
)
Tourist overnight stays per resident
2011
: 2.1 no (from
http://epp.eurostat.ec.europa.eu/
)
Demography
1-person households
2009
: 84394 no (from
http://epp.eurostat.ec.europa.eu/
)
2010
: 85386 no (from
http://epp.eurostat.ec.europa.eu/
)
2011
: 86908 no (from
http://epp.eurostat.ec.europa.eu/
)
Age Dependency Ratio
2009
: 68.1 % (from
http://epp.eurostat.ec.europa.eu/
)
2010
: 68.4 % (from
http://epp.eurostat.ec.europa.eu/
)
2011
: 69.0 % (from
http://epp.eurostat.ec.europa.eu/
)
Avg household-size
2009
: 2.2 persons (from
http://epp.eurostat.ec.europa.eu/
)
2010
: 2.1 persons (from
http://epp.eurostat.ec.europa.eu/
)
2011
: 2.1 persons (from
http://epp.eurostat.ec.europa.eu/
)
Conventional dwellings
2009
: 236072 Conventional dwellings (from
http://epp.eurostat.ec.europa.eu/
)
2010
: 237478 Conventional dwellings (from
http://epp.eurostat.ec.europa.eu/
)
2011
: 239755 Conventional dwellings (from
http://epp.eurostat.ec.europa.eu/
)
Conventional dwellings
2009
: 236072 no (from
http://epp.eurostat.ec.europa.eu/
)
2010
: 237478 no (from
http://epp.eurostat.ec.europa.eu/
)
2011
: 239755 no (from
http://epp.eurostat.ec.europa.eu/
)
Country
2015
:
http://dbpedia.org/resource/France
(from
http://dbpedia.org/
)
Dwellings
2009
: 236072 Conventional dwellings (from
http://epp.eurostat.ec.europa.eu/
)
2010
: 237478 Conventional dwellings (from
http://epp.eurostat.ec.europa.eu/
)
2011
: 239755 Conventional dwellings (from
http://epp.eurostat.ec.europa.eu/
)
Dwellings
2009
: 236072 no (from
http://epp.eurostat.ec.europa.eu/
)
2010
: 237478 no (from
http://epp.eurostat.ec.europa.eu/
)
2011
: 239755 no (from
http://epp.eurostat.ec.europa.eu/
)
EU Foreigners
2009
: 4218 persons (from
http://epp.eurostat.ec.europa.eu/
)
2010
: 4302 persons (from
http://epp.eurostat.ec.europa.eu/
)
2011
: 4499 persons (from
http://epp.eurostat.ec.europa.eu/
)
Foreign-borns
2009
: 40153 persons (from
http://epp.eurostat.ec.europa.eu/
)
2010
: 41500 persons (from
http://epp.eurostat.ec.europa.eu/
)
2011
: 43019 persons (from
http://epp.eurostat.ec.europa.eu/
)
Foreign-borns (in a EU country)
2009
: 7589 persons (from
http://epp.eurostat.ec.europa.eu/
)
2010
: 7801 persons (from
http://epp.eurostat.ec.europa.eu/
)
2011
: 7976 persons (from
http://epp.eurostat.ec.europa.eu/
)
Foreign-borns (outside EU)
2009
: 32564 persons (from
http://epp.eurostat.ec.europa.eu/
)
2010
: 33700 persons (from
http://epp.eurostat.ec.europa.eu/
)
2011
: 35043 persons (from
http://epp.eurostat.ec.europa.eu/
)
Foreigners
2009
: 21112 persons (from
http://epp.eurostat.ec.europa.eu/
)
2010
: 21918 persons (from
http://epp.eurostat.ec.europa.eu/
)
2011
: 22913 persons (from
http://epp.eurostat.ec.europa.eu/
)
Households with children 0-17
2009
: 60010 no (from
http://epp.eurostat.ec.europa.eu/
)
2010
: 59816 no (from
http://epp.eurostat.ec.europa.eu/
)
2011
: 59536 no (from
http://epp.eurostat.ec.europa.eu/
)
Lone parent households with children 0-17
2009
: 14814 no (from
http://epp.eurostat.ec.europa.eu/
)
2010
: 14939 no (from
http://epp.eurostat.ec.europa.eu/
)
2011
: 15149 no (from
http://epp.eurostat.ec.europa.eu/
)
Lone-pensioners households above retirement age
2009
: 32664 no (from
http://epp.eurostat.ec.europa.eu/
)
2010
: 33292 no (from
http://epp.eurostat.ec.europa.eu/
)
2011
: 34134 no (from
http://epp.eurostat.ec.europa.eu/
)
Median Age
2009
: 37.00 years (from
http://epp.eurostat.ec.europa.eu/
)
2010
: 38.00 years (from
http://epp.eurostat.ec.europa.eu/
)
2011
: 38.00 years (from
http://epp.eurostat.ec.europa.eu/
)
Nationals
2009
: 465407 persons (from
http://epp.eurostat.ec.europa.eu/
)
2010
: 464334 persons (from
http://epp.eurostat.ec.europa.eu/
)
2011
: 464011 persons (from
http://epp.eurostat.ec.europa.eu/
)
Native-borns
2009
: 446366 persons (from
http://epp.eurostat.ec.europa.eu/
)
2010
: 444752 persons (from
http://epp.eurostat.ec.europa.eu/
)
2011
: 443905 persons (from
http://epp.eurostat.ec.europa.eu/
)
Non-EU Foreigners
2009
: 16894 persons (from
http://epp.eurostat.ec.europa.eu/
)
2010
: 17616 persons (from
http://epp.eurostat.ec.europa.eu/
)
2011
: 18414 persons (from
http://epp.eurostat.ec.europa.eu/
)
Old Age Dependency Ratio
2009
: 26.9 % (from
http://epp.eurostat.ec.europa.eu/
)
2010
: 27.2 % (from
http://epp.eurostat.ec.europa.eu/
)
2011
: 27.8 % (from
http://epp.eurostat.ec.europa.eu/
)
Population
1999
: 389929 persons (from
http://data.un.org/
)
2008
: 109425 persons (from
http://data.un.org/
)
2009
: 110688 persons (from
http://data.un.org/
)
2009
: 486492 persons (from
http://epp.eurostat.ec.europa.eu/
)
2010
: 463747.999999893 persons (from
http://data.un.org/
)
2010
: 486298 persons (from
http://epp.eurostat.ec.europa.eu/
)
2011
: 487136 persons (from
http://epp.eurostat.ec.europa.eu/
)
2015
: 111000 persons (from
http://dbpedia.org/
)
Population 0-4
2009
: 28890 persons (from
http://epp.eurostat.ec.europa.eu/
)
2010
: 28947 persons (from
http://epp.eurostat.ec.europa.eu/
)
2011
: 29159 persons (from
http://epp.eurostat.ec.europa.eu/
)
Population 0-4 female
2009
: 14011 persons (from
http://epp.eurostat.ec.europa.eu/
)
2010
: 13985 persons (from
http://epp.eurostat.ec.europa.eu/
)
2011
: 14113 persons (from
http://epp.eurostat.ec.europa.eu/
)
Population 0-4 male
2009
: 14879 persons (from
http://epp.eurostat.ec.europa.eu/
)
2010
: 14962 persons (from
http://epp.eurostat.ec.europa.eu/
)
2011
: 15045 persons (from
http://epp.eurostat.ec.europa.eu/
)
Population 10-14
2009
: 28243 persons (from
http://epp.eurostat.ec.europa.eu/
)
2010
: 28185 persons (from
http://epp.eurostat.ec.europa.eu/
)
2011
: 28103 persons (from
http://epp.eurostat.ec.europa.eu/
)
Population 10-14 female
2009
: 13828 persons (from
http://epp.eurostat.ec.europa.eu/
)
2010
: 13837 persons (from
http://epp.eurostat.ec.europa.eu/
)
2011
: 13898 persons (from
http://epp.eurostat.ec.europa.eu/
)
Population 10-14 male
2009
: 14415 persons (from
http://epp.eurostat.ec.europa.eu/
)
2010
: 14348 persons (from
http://epp.eurostat.ec.europa.eu/
)
2011
: 14206 persons (from
http://epp.eurostat.ec.europa.eu/
)
Population 15-19
2009
: 34499 persons (from
http://epp.eurostat.ec.europa.eu/
)
2010
: 34227 persons (from
http://epp.eurostat.ec.europa.eu/
)
2011
: 33783 persons (from
http://epp.eurostat.ec.europa.eu/
)
Population 15-19 female
2009
: 17235 persons (from
http://epp.eurostat.ec.europa.eu/
)
2010
: 16876 persons (from
http://epp.eurostat.ec.europa.eu/
)
2011
: 16744 persons (from
http://epp.eurostat.ec.europa.eu/
)
Population 15-19 male
2009
: 17264 persons (from
http://epp.eurostat.ec.europa.eu/
)
2010
: 17351 persons (from
http://epp.eurostat.ec.europa.eu/
)
2011
: 17039 persons (from
http://epp.eurostat.ec.europa.eu/
)
Population 20-24
2009
: 41403 persons (from
http://epp.eurostat.ec.europa.eu/
)
2010
: 40598 persons (from
http://epp.eurostat.ec.europa.eu/
)
2011
: 40418 persons (from
http://epp.eurostat.ec.europa.eu/
)
Population 20-24 female
2009
: 20950 persons (from
http://epp.eurostat.ec.europa.eu/
)
2010
: 20820 persons (from
http://epp.eurostat.ec.europa.eu/
)
2011
: 20611 persons (from
http://epp.eurostat.ec.europa.eu/
)
Population 20-24 male
2009
: 20453 persons (from
http://epp.eurostat.ec.europa.eu/
)
2010
: 19778 persons (from
http://epp.eurostat.ec.europa.eu/
)
2011
: 19807 persons (from
http://epp.eurostat.ec.europa.eu/
)
Population 25-34
2009
: 65035 persons (from
http://epp.eurostat.ec.europa.eu/
)
2010
: 64608 persons (from
http://epp.eurostat.ec.europa.eu/
)
2011
: 64657 persons (from
http://epp.eurostat.ec.europa.eu/
)
Population 25-34 female
2009
: 32878 persons (from
http://epp.eurostat.ec.europa.eu/
)
2010
: 32716 persons (from
http://epp.eurostat.ec.europa.eu/
)
2011
: 32510 persons (from
http://epp.eurostat.ec.europa.eu/
)
Population 25-34 male
2009
: 32157 persons (from
http://epp.eurostat.ec.europa.eu/
)
2010
: 31891 persons (from
http://epp.eurostat.ec.europa.eu/
)
2011
: 32147 persons (from
http://epp.eurostat.ec.europa.eu/
)
Population 35-44
2009
: 61459 persons (from
http://epp.eurostat.ec.europa.eu/
)
2010
: 60901 persons (from
http://epp.eurostat.ec.europa.eu/
)
2011
: 60271 persons (from
http://epp.eurostat.ec.europa.eu/
)
Population 35-44 female
2009
: 31447 persons (from
http://epp.eurostat.ec.europa.eu/
)
2010
: 31079 persons (from
http://epp.eurostat.ec.europa.eu/
)
2011
: 30649 persons (from
http://epp.eurostat.ec.europa.eu/
)
Population 35-44 male
2009
: 30012 persons (from
http://epp.eurostat.ec.europa.eu/
)
2010
: 29822 persons (from
http://epp.eurostat.ec.europa.eu/
)
2011
: 29622 persons (from
http://epp.eurostat.ec.europa.eu/
)
Population 45-54
2009
: 64365 persons (from
http://epp.eurostat.ec.europa.eu/
)
2010
: 64182 persons (from
http://epp.eurostat.ec.europa.eu/
)
2011
: 63608 persons (from
http://epp.eurostat.ec.europa.eu/
)
Population 45-54 female
2009
: 33648 persons (from
http://epp.eurostat.ec.europa.eu/
)
2010
: 33623 persons (from
http://epp.eurostat.ec.europa.eu/
)
2011
: 33192 persons (from
http://epp.eurostat.ec.europa.eu/
)
Population 45-54 male
2009
: 30716 persons (from
http://epp.eurostat.ec.europa.eu/
)
2010
: 30560 persons (from
http://epp.eurostat.ec.europa.eu/
)
2011
: 30416 persons (from
http://epp.eurostat.ec.europa.eu/
)
Population 5-9
2009
: 27614 persons (from
http://epp.eurostat.ec.europa.eu/
)
2010
: 27678 persons (from
http://epp.eurostat.ec.europa.eu/
)
2011
: 27537 persons (from
http://epp.eurostat.ec.europa.eu/
)
Population 5-9 female
2009
: 13537 persons (from
http://epp.eurostat.ec.europa.eu/
)
2010
: 13543 persons (from
http://epp.eurostat.ec.europa.eu/
)
2011
: 13478 persons (from
http://epp.eurostat.ec.europa.eu/
)
Population 5-9 male
2009
: 14076 persons (from
http://epp.eurostat.ec.europa.eu/
)
2010
: 14134 persons (from
http://epp.eurostat.ec.europa.eu/
)
2011
: 14059 persons (from
http://epp.eurostat.ec.europa.eu/
)
Population 55-64
2009
: 57142 persons (from
http://epp.eurostat.ec.europa.eu/
)
2010
: 58501 persons (from
http://epp.eurostat.ec.europa.eu/
)
2011
: 59352 persons (from
http://epp.eurostat.ec.europa.eu/
)
Population 55-64 female
2009
: 30124 persons (from
http://epp.eurostat.ec.europa.eu/
)
2010
: 30691 persons (from
http://epp.eurostat.ec.europa.eu/
)
2011
: 31400 persons (from
http://epp.eurostat.ec.europa.eu/
)
Population 55-64 male
2009
: 27018 persons (from
http://epp.eurostat.ec.europa.eu/
)
2010
: 27810 persons (from
http://epp.eurostat.ec.europa.eu/
)
2011
: 27953 persons (from
http://epp.eurostat.ec.europa.eu/
)
Population 65-74
2009
: 35831 persons (from
http://epp.eurostat.ec.europa.eu/
)
2010
: 35536 persons (from
http://epp.eurostat.ec.europa.eu/
)
2011
: 36534 persons (from
http://epp.eurostat.ec.europa.eu/
)
Population 65-74 female
2009
: 20378 persons (from
http://epp.eurostat.ec.europa.eu/
)
2010
: 20077 persons (from
http://epp.eurostat.ec.europa.eu/
)
2011
: 20503 persons (from
http://epp.eurostat.ec.europa.eu/
)
Population 65-74 male
2009
: 15453 persons (from
http://epp.eurostat.ec.europa.eu/
)
2010
: 15459 persons (from
http://epp.eurostat.ec.europa.eu/
)
2011
: 16031 persons (from
http://epp.eurostat.ec.europa.eu/
)
Population 75+
2009
: 42011 persons (from
http://epp.eurostat.ec.europa.eu/
)
2010
: 42936 persons (from
http://epp.eurostat.ec.europa.eu/
)
2011
: 43714 persons (from
http://epp.eurostat.ec.europa.eu/
)
Population 75+ female
2009
: 27419 persons (from
http://epp.eurostat.ec.europa.eu/
)
2010
: 28188 persons (from
http://epp.eurostat.ec.europa.eu/
)
2011
: 28735 persons (from
http://epp.eurostat.ec.europa.eu/
)
Population 75+ male
2009
: 14592 persons (from
http://epp.eurostat.ec.europa.eu/
)
2010
: 14748 persons (from
http://epp.eurostat.ec.europa.eu/
)
2011
: 14979 persons (from
http://epp.eurostat.ec.europa.eu/
)
Population change
2010
: 0.0 % (from
http://epp.eurostat.ec.europa.eu/
)
2011
: 0.2 % (from
http://epp.eurostat.ec.europa.eu/
)
Population female
1999
: 204852 persons (from
http://data.un.org/
)
2009
: 255456 persons (from
http://epp.eurostat.ec.europa.eu/
)
2010
: 244331.881590896 persons (from
http://data.un.org/
)
2010
: 255435 persons (from
http://epp.eurostat.ec.europa.eu/
)
2011
: 255834 persons (from
http://epp.eurostat.ec.europa.eu/
)
Population in private households
2009
: 474175 persons (from
http://epp.eurostat.ec.europa.eu/
)
2010
: 474085 persons (from
http://epp.eurostat.ec.europa.eu/
)
2011
: 475199 persons (from
http://epp.eurostat.ec.europa.eu/
)
Population male
1999
: 185077 persons (from
http://data.un.org/
)
2009
: 231036 persons (from
http://epp.eurostat.ec.europa.eu/
)
2010
: 219416.118408997 persons (from
http://data.un.org/
)
2010
: 230863 persons (from
http://epp.eurostat.ec.europa.eu/
)
2011
: 231303 persons (from
http://epp.eurostat.ec.europa.eu/
)
Private households
2009
: 219829 no (from
http://epp.eurostat.ec.europa.eu/
)
2010
: 220773 no (from
http://epp.eurostat.ec.europa.eu/
)
2011
: 222666 no (from
http://epp.eurostat.ec.europa.eu/
)
Proportion 1-person households
2009
: 38.4 % (from
http://epp.eurostat.ec.europa.eu/
)
2010
: 38.7 % (from
http://epp.eurostat.ec.europa.eu/
)
2011
: 39.0 % (from
http://epp.eurostat.ec.europa.eu/
)
Proportion EU Foreigners
2009
: 0.9 % (from
http://epp.eurostat.ec.europa.eu/
)
2010
: 0.9 % (from
http://epp.eurostat.ec.europa.eu/
)
2011
: 0.9 % (from
http://epp.eurostat.ec.europa.eu/
)
Proportion Foreigners
2009
: 4.3 % (from
http://epp.eurostat.ec.europa.eu/
)
2010
: 4.5 % (from
http://epp.eurostat.ec.europa.eu/
)
2011
: 4.7 % (from
http://epp.eurostat.ec.europa.eu/
)
Proportion Nationals
2009
: 95.7 % (from
http://epp.eurostat.ec.europa.eu/
)
2010
: 95.5 % (from
http://epp.eurostat.ec.europa.eu/
)
2011
: 95.3 % (from
http://epp.eurostat.ec.europa.eu/
)
Proportion Non-EU Foreigners
2009
: 3.5 % (from
http://epp.eurostat.ec.europa.eu/
)
2010
: 3.6 % (from
http://epp.eurostat.ec.europa.eu/
)
2011
: 3.8 % (from
http://epp.eurostat.ec.europa.eu/
)
Proportion aged 0-4
2009
: 5.9 % (from
http://epp.eurostat.ec.europa.eu/
)
2010
: 6.0 % (from
http://epp.eurostat.ec.europa.eu/
)
2011
: 6.0 % (from
http://epp.eurostat.ec.europa.eu/
)
Proportion aged 10-14
2009
: 5.8 % (from
http://epp.eurostat.ec.europa.eu/
)
2010
: 5.8 % (from
http://epp.eurostat.ec.europa.eu/
)
2011
: 5.8 % (from
http://epp.eurostat.ec.europa.eu/
)
Proportion aged 15-19
2009
: 7.1 % (from
http://epp.eurostat.ec.europa.eu/
)
2010
: 7.0 % (from
http://epp.eurostat.ec.europa.eu/
)
2011
: 6.9 % (from
http://epp.eurostat.ec.europa.eu/
)
Proportion aged 20-24
2009
: 8.5 % (from
http://epp.eurostat.ec.europa.eu/
)
2010
: 8.3 % (from
http://epp.eurostat.ec.europa.eu/
)
2011
: 8.3 % (from
http://epp.eurostat.ec.europa.eu/
)
Proportion aged 25-34
2009
: 13.4 % (from
http://epp.eurostat.ec.europa.eu/
)
2010
: 13.3 % (from
http://epp.eurostat.ec.europa.eu/
)
2011
: 13.3 % (from
http://epp.eurostat.ec.europa.eu/
)
Proportion aged 35-44
2009
: 12.6 % (from
http://epp.eurostat.ec.europa.eu/
)
2010
: 12.5 % (from
http://epp.eurostat.ec.europa.eu/
)
2011
: 12.4 % (from
http://epp.eurostat.ec.europa.eu/
)
Proportion aged 45-54
2009
: 13.2 % (from
http://epp.eurostat.ec.europa.eu/
)
2010
: 13.2 % (from
http://epp.eurostat.ec.europa.eu/
)
2011
: 13.1 % (from
http://epp.eurostat.ec.europa.eu/
)
Proportion aged 5-9
2009
: 5.7 % (from
http://epp.eurostat.ec.europa.eu/
)
2010
: 5.7 % (from
http://epp.eurostat.ec.europa.eu/
)
2011
: 5.7 % (from
http://epp.eurostat.ec.europa.eu/
)
Proportion aged 55-64
2009
: 11.7 % (from
http://epp.eurostat.ec.europa.eu/
)
2010
: 12.0 % (from
http://epp.eurostat.ec.europa.eu/
)
2011
: 12.2 % (from
http://epp.eurostat.ec.europa.eu/
)
Proportion aged 65-74
2009
: 7.4 % (from
http://epp.eurostat.ec.europa.eu/
)
2010
: 7.3 % (from
http://epp.eurostat.ec.europa.eu/
)
2011
: 7.5 % (from
http://epp.eurostat.ec.europa.eu/
)
Proportion aged 75+
2009
: 8.6 % (from
http://epp.eurostat.ec.europa.eu/
)
2010
: 8.8 % (from
http://epp.eurostat.ec.europa.eu/
)
2011
: 9.0 % (from
http://epp.eurostat.ec.europa.eu/
)
Proportion foreign-borns
2009
: 8.3 % (from
http://epp.eurostat.ec.europa.eu/
)
2010
: 8.5 % (from
http://epp.eurostat.ec.europa.eu/
)
2011
: 8.8 % (from
http://epp.eurostat.ec.europa.eu/
)
Proportion households with children 0-17
2009
: 24.7 % (from
http://epp.eurostat.ec.europa.eu/
)
2010
: 25.0 % (from
http://epp.eurostat.ec.europa.eu/
)
2011
: 25.4 % (from
http://epp.eurostat.ec.europa.eu/
)
Proportion households with children 0-17
2009
: 27.3 % (from
http://epp.eurostat.ec.europa.eu/
)
2010
: 27.1 % (from
http://epp.eurostat.ec.europa.eu/
)
2011
: 26.7 % (from
http://epp.eurostat.ec.europa.eu/
)
Proportion lone-parent households
2009
: 6.7 % (from
http://epp.eurostat.ec.europa.eu/
)
2010
: 6.8 % (from
http://epp.eurostat.ec.europa.eu/
)
2011
: 6.8 % (from
http://epp.eurostat.ec.europa.eu/
)
Proportion lone-pensioner households
2009
: 14.9 % (from
http://epp.eurostat.ec.europa.eu/
)
2010
: 15.1 % (from
http://epp.eurostat.ec.europa.eu/
)
2011
: 15.3 % (from
http://epp.eurostat.ec.europa.eu/
)
Proportion native-borns
2009
: 91.8 % (from
http://epp.eurostat.ec.europa.eu/
)
2010
: 91.5 % (from
http://epp.eurostat.ec.europa.eu/
)
2011
: 91.1 % (from
http://epp.eurostat.ec.europa.eu/
)
Women per 100 Men
2009
: 110.6 no (from
http://epp.eurostat.ec.europa.eu/
)
2010
: 110.6 no (from
http://epp.eurostat.ec.europa.eu/
)
2011
: 110.6 no (from
http://epp.eurostat.ec.europa.eu/
)
Women per 100 Men 75+
2009
: 187.9 no (from
http://epp.eurostat.ec.europa.eu/
)
2010
: 191.1 no (from
http://epp.eurostat.ec.europa.eu/
)
2011
: 191.8 no (from
http://epp.eurostat.ec.europa.eu/
)
Young Age Dependency Ratio
2009
: 41.2 % (from
http://epp.eurostat.ec.europa.eu/
)
2010
: 41.2 % (from
http://epp.eurostat.ec.europa.eu/
)
2011
: 41.1 % (from
http://epp.eurostat.ec.europa.eu/
)
Economic Aspects
Activity Rate
2009
: 56.6 % (from
http://epp.eurostat.ec.europa.eu/
)
2010
: 56.7 % (from
http://epp.eurostat.ec.europa.eu/
)
2011
: 56.8 % (from
http://epp.eurostat.ec.europa.eu/
)
Activity Rate female
2009
: 52.0 % (from
http://epp.eurostat.ec.europa.eu/
)
2010
: 52.3 % (from
http://epp.eurostat.ec.europa.eu/
)
2011
: 52.5 % (from
http://epp.eurostat.ec.europa.eu/
)
Activity Rate male
2009
: 61.8 % (from
http://epp.eurostat.ec.europa.eu/
)
2010
: 61.7 % (from
http://epp.eurostat.ec.europa.eu/
)
2011
: 61.7 % (from
http://epp.eurostat.ec.europa.eu/
)
Economically Active Population
2009
: 227224 persons (from
http://epp.eurostat.ec.europa.eu/
)
2010
: 227643 persons (from
http://epp.eurostat.ec.europa.eu/
)
2011
: 228530 persons (from
http://epp.eurostat.ec.europa.eu/
)
Economically Active Population 20-64
2009
: 219670 persons (from
http://epp.eurostat.ec.europa.eu/
)
2010
: 219860 persons (from
http://epp.eurostat.ec.europa.eu/
)
2011
: 220498 persons (from
http://epp.eurostat.ec.europa.eu/
)
Economically Active Population 20-64 female
2009
: 107925 persons (from
http://epp.eurostat.ec.europa.eu/
)
2010
: 108540 persons (from
http://epp.eurostat.ec.europa.eu/
)
2011
: 108897 persons (from
http://epp.eurostat.ec.europa.eu/
)
Economically Active Population 20-64 male
2009
: 111745 persons (from
http://epp.eurostat.ec.europa.eu/
)
2010
: 111320 persons (from
http://epp.eurostat.ec.europa.eu/
)
2011
: 111601 persons (from
http://epp.eurostat.ec.europa.eu/
)
Economically Active Population 55-64
2009
: 22980 persons (from
http://epp.eurostat.ec.europa.eu/
)
2010
: 24023 persons (from
http://epp.eurostat.ec.europa.eu/
)
2011
: 25423 persons (from
http://epp.eurostat.ec.europa.eu/
)
Economically Active Population 55-64 female
2009
: 11473 persons (from
http://epp.eurostat.ec.europa.eu/
)
2010
: 11951 persons (from
http://epp.eurostat.ec.europa.eu/
)
2011
: 12830 persons (from
http://epp.eurostat.ec.europa.eu/
)
Economically Active Population 55-64 male
2009
: 11506 persons (from
http://epp.eurostat.ec.europa.eu/
)
2010
: 12072 persons (from
http://epp.eurostat.ec.europa.eu/
)
2011
: 12592 persons (from
http://epp.eurostat.ec.europa.eu/
)
Economically Active Population female
2009
: 111250 persons (from
http://epp.eurostat.ec.europa.eu/
)
2010
: 111952 persons (from
http://epp.eurostat.ec.europa.eu/
)
2011
: 112483 persons (from
http://epp.eurostat.ec.europa.eu/
)
Economically Active Population male
2009
: 115974 persons (from
http://epp.eurostat.ec.europa.eu/
)
2010
: 115690 persons (from
http://epp.eurostat.ec.europa.eu/
)
2011
: 116046 persons (from
http://epp.eurostat.ec.europa.eu/
)
Employed persons 20-64
2009
: 192465 persons (from
http://epp.eurostat.ec.europa.eu/
)
2010
: 191281 persons (from
http://epp.eurostat.ec.europa.eu/
)
2011
: 189670 persons (from
http://epp.eurostat.ec.europa.eu/
)
Employed persons 20-64 female
2009
: 94574 persons (from
http://epp.eurostat.ec.europa.eu/
)
2010
: 94426 persons (from
http://epp.eurostat.ec.europa.eu/
)
2011
: 93987 persons (from
http://epp.eurostat.ec.europa.eu/
)
Employed persons 20-64 male
2009
: 97890 persons (from
http://epp.eurostat.ec.europa.eu/
)
2010
: 96855 persons (from
http://epp.eurostat.ec.europa.eu/
)
2011
: 95684 persons (from
http://epp.eurostat.ec.europa.eu/
)
Employed persons 55-64
2009
: 20967 persons (from
http://epp.eurostat.ec.europa.eu/
)
2010
: 21879 persons (from
http://epp.eurostat.ec.europa.eu/
)
2011
: 23009 persons (from
http://epp.eurostat.ec.europa.eu/
)
Employed persons 55-64 female
2009
: 10525 persons (from
http://epp.eurostat.ec.europa.eu/
)
2010
: 10927 persons (from
http://epp.eurostat.ec.europa.eu/
)
2011
: 11679 persons (from
http://epp.eurostat.ec.europa.eu/
)
Employed persons 55-64 male
2009
: 10442 persons (from
http://epp.eurostat.ec.europa.eu/
)
2010
: 10952 persons (from
http://epp.eurostat.ec.europa.eu/
)
2011
: 11330 persons (from
http://epp.eurostat.ec.europa.eu/
)
Employment divided by Jobs
2009
: 229221 % (from
http://epp.eurostat.ec.europa.eu/
)
2010
: 228773 % (from
http://epp.eurostat.ec.europa.eu/
)
2011
: 227963 % (from
http://epp.eurostat.ec.europa.eu/
)
Employment proportion agriculture and fishery
2009
: 0.4 % (from
http://epp.eurostat.ec.europa.eu/
)
2010
: 0.3 % (from
http://epp.eurostat.ec.europa.eu/
)
2011
: 0.4 % (from
http://epp.eurostat.ec.europa.eu/
)
Employment proportion construction
2009
: 7.0 % (from
http://epp.eurostat.ec.europa.eu/
)
2010
: 7.0 % (from
http://epp.eurostat.ec.europa.eu/
)
2011
: 7.0 % (from
http://epp.eurostat.ec.europa.eu/
)
Employment proportion industries
2009
: 13.7 % (from
http://epp.eurostat.ec.europa.eu/
)
2010
: 13.4 % (from
http://epp.eurostat.ec.europa.eu/
)
2011
: 12.9 % (from
http://epp.eurostat.ec.europa.eu/
)
Household income (median)
2011
: 26964.00 EUR (from
http://epp.eurostat.ec.europa.eu/
)
Jobs in agriculture and fishery
2009
: 806 no (from
http://epp.eurostat.ec.europa.eu/
)
2010
: 798 no (from
http://epp.eurostat.ec.europa.eu/
)
2011
: 870 no (from
http://epp.eurostat.ec.europa.eu/
)
Jobs in arts entertainment and recreation household activites
2009
: 12067 no (from
http://epp.eurostat.ec.europa.eu/
)
2010
: 12142 no (from
http://epp.eurostat.ec.europa.eu/
)
2011
: 12316 no (from
http://epp.eurostat.ec.europa.eu/
)
Jobs in construction
2009
: 15975 no (from
http://epp.eurostat.ec.europa.eu/
)
2010
: 16010 no (from
http://epp.eurostat.ec.europa.eu/
)
2011
: 15844 no (from
http://epp.eurostat.ec.europa.eu/
)
Jobs in financial and insurance activities
2009
: 9399 no (from
http://epp.eurostat.ec.europa.eu/
)
2010
: 9520 no (from
http://epp.eurostat.ec.europa.eu/
)
2011
: 9674 no (from
http://epp.eurostat.ec.europa.eu/
)
Jobs in information and communication
2009
: 4150 no (from
http://epp.eurostat.ec.europa.eu/
)
2010
: 4092 no (from
http://epp.eurostat.ec.europa.eu/
)
2011
: 4164 no (from
http://epp.eurostat.ec.europa.eu/
)
Jobs in mining manufacturing energy
2009
: 31442 no (from
http://epp.eurostat.ec.europa.eu/
)
2010
: 30555 no (from
http://epp.eurostat.ec.europa.eu/
)
2011
: 29518 no (from
http://epp.eurostat.ec.europa.eu/
)
Jobs in professional scientific technical administrative and support service
2009
: 24845 no (from
http://epp.eurostat.ec.europa.eu/
)
2010
: 25153 no (from
http://epp.eurostat.ec.europa.eu/
)
2011
: 24993 no (from
http://epp.eurostat.ec.europa.eu/
)
Jobs in public administration defence education health and social work
2009
: 75501 no (from
http://epp.eurostat.ec.europa.eu/
)
2010
: 75652 no (from
http://epp.eurostat.ec.europa.eu/
)
2011
: 76030 no (from
http://epp.eurostat.ec.europa.eu/
)
Jobs in real estate activities
2009
: 3644 no (from
http://epp.eurostat.ec.europa.eu/
)
2010
: 3591 no (from
http://epp.eurostat.ec.europa.eu/
)
2011
: 3682 no (from
http://epp.eurostat.ec.europa.eu/
)
Jobs in trade transport hotels restaraunts
2009
: 51392 no (from
http://epp.eurostat.ec.europa.eu/
)
2010
: 51259 no (from
http://epp.eurostat.ec.europa.eu/
)
2011
: 50872 no (from
http://epp.eurostat.ec.europa.eu/
)
No companies
2011
: 19500 no (from
http://epp.eurostat.ec.europa.eu/
)
2012
: 19806 no (from
http://epp.eurostat.ec.europa.eu/
)
Unemployed Persons
2009
: 29669 persons (from
http://epp.eurostat.ec.europa.eu/
)
2010
: 31191 persons (from
http://epp.eurostat.ec.europa.eu/
)
2011
: 33618 persons (from
http://epp.eurostat.ec.europa.eu/
)
Unemployed Persons female
2009
: 14489 persons (from
http://epp.eurostat.ec.europa.eu/
)
2010
: 15294 persons (from
http://epp.eurostat.ec.europa.eu/
)
2011
: 16175 persons (from
http://epp.eurostat.ec.europa.eu/
)
Unemployed Persons male
2009
: 15180 persons (from
http://epp.eurostat.ec.europa.eu/
)
2010
: 15897 persons (from
http://epp.eurostat.ec.europa.eu/
)
2011
: 17444 persons (from
http://epp.eurostat.ec.europa.eu/
)
Unemployment Rate
2009
: 13.1 % (from
http://epp.eurostat.ec.europa.eu/
)
2010
: 13.7 % (from
http://epp.eurostat.ec.europa.eu/
)
2011
: 14.7 % (from
http://epp.eurostat.ec.europa.eu/
)
Unemployment rate female
2009
: 13.0 % (from
http://epp.eurostat.ec.europa.eu/
)
2010
: 13.7 % (from
http://epp.eurostat.ec.europa.eu/
)
2011
: 14.4 % (from
http://epp.eurostat.ec.europa.eu/
)
Unemployment rate male
2009
: 13.1 % (from
http://epp.eurostat.ec.europa.eu/
)
2010
: 13.7 % (from
http://epp.eurostat.ec.europa.eu/
)
2011
: 15.0 % (from
http://epp.eurostat.ec.europa.eu/
)
Environment
Accumulated ozone concentration
1999
: 2963.75 microgram per m3 (from
http://epp.eurostat.ec.europa.eu/
)
2000
: 2004.20 microgram per m3 (from
http://epp.eurostat.ec.europa.eu/
)
2001
: 3298.60 microgram per m3 (from
http://epp.eurostat.ec.europa.eu/
)
2002
: 2379.00 microgram per m3 (from
http://epp.eurostat.ec.europa.eu/
)
2003
: 4562.83 microgram per m3 (from
http://epp.eurostat.ec.europa.eu/
)
2004
: 2250.50 microgram per m3 (from
http://epp.eurostat.ec.europa.eu/
)
2005
: 2494.40 microgram per m3 (from
http://epp.eurostat.ec.europa.eu/
)
2006
: 3427.80 microgram per m3 (from
http://epp.eurostat.ec.europa.eu/
)
2007
: 2516.00 microgram per m3 (from
http://epp.eurostat.ec.europa.eu/
)
2008
: 3029.00 microgram per m3 (from
http://epp.eurostat.ec.europa.eu/
)
2009
: 2785.00 microgram per m3 (from
http://epp.eurostat.ec.europa.eu/
)
2010
: 2783.00 microgram per m3 (from
http://epp.eurostat.ec.europa.eu/
)
2011
: 3072.25 microgram per m3 (from
http://epp.eurostat.ec.europa.eu/
)
2012
: 2637.67 microgram per m3 (from
http://epp.eurostat.ec.europa.eu/
)
Average NO2 concentration
1999
: 34.41 microgram per m3 (from
http://epp.eurostat.ec.europa.eu/
)
2000
: 36.00 microgram per m3 (from
http://epp.eurostat.ec.europa.eu/
)
2001
: 32.25 microgram per m3 (from
http://epp.eurostat.ec.europa.eu/
)
2002
: 32.34 microgram per m3 (from
http://epp.eurostat.ec.europa.eu/
)
2003
: 32.19 microgram per m3 (from
http://epp.eurostat.ec.europa.eu/
)
2004
: 28.13 microgram per m3 (from
http://epp.eurostat.ec.europa.eu/
)
2005
: 28.05 microgram per m3 (from
http://epp.eurostat.ec.europa.eu/
)
2006
: 28.73 microgram per m3 (from
http://epp.eurostat.ec.europa.eu/
)
2007
: 29.23 microgram per m3 (from
http://epp.eurostat.ec.europa.eu/
)
2008
: 28.21 microgram per m3 (from
http://epp.eurostat.ec.europa.eu/
)
2009
: 28.84 microgram per m3 (from
http://epp.eurostat.ec.europa.eu/
)
2010
: 27.62 microgram per m3 (from
http://epp.eurostat.ec.europa.eu/
)
2011
: 26.53 microgram per m3 (from
http://epp.eurostat.ec.europa.eu/
)
2012
: 25.75 microgram per m3 (from
http://epp.eurostat.ec.europa.eu/
)
Average Particulate Matter concentration
2001
: 21.38 microgram per m3 (from
http://epp.eurostat.ec.europa.eu/
)
2002
: 21.04 microgram per m3 (from
http://epp.eurostat.ec.europa.eu/
)
2003
: 22.02 microgram per m3 (from
http://epp.eurostat.ec.europa.eu/
)
2004
: 19.47 microgram per m3 (from
http://epp.eurostat.ec.europa.eu/
)
2005
: 20.83 microgram per m3 (from
http://epp.eurostat.ec.europa.eu/
)
2006
: 21.10 microgram per m3 (from
http://epp.eurostat.ec.europa.eu/
)
2007
: 27.71 microgram per m3 (from
http://epp.eurostat.ec.europa.eu/
)
2008
: 23.20 microgram per m3 (from
http://epp.eurostat.ec.europa.eu/
)
2009
: 26.07 microgram per m3 (from
http://epp.eurostat.ec.europa.eu/
)
2010
: 25.50 microgram per m3 (from
http://epp.eurostat.ec.europa.eu/
)
2011
: 25.47 microgram per m3 (from
http://epp.eurostat.ec.europa.eu/
)
2012
: 24.56 microgram per m3 (from
http://epp.eurostat.ec.europa.eu/
)
Days with high NO2 concentrations
1999
: 0.00 days (from
http://epp.eurostat.ec.europa.eu/
)
2000
: 0.00 days (from
http://epp.eurostat.ec.europa.eu/
)
2001
: 0.00 days (from
http://epp.eurostat.ec.europa.eu/
)
2002
: 0.00 days (from
http://epp.eurostat.ec.europa.eu/
)
2003
: 0.00 days (from
http://epp.eurostat.ec.europa.eu/
)
2004
: 0.00 days (from
http://epp.eurostat.ec.europa.eu/
)
2005
: 1.00 days (from
http://epp.eurostat.ec.europa.eu/
)
2006
: 0.00 days (from
http://epp.eurostat.ec.europa.eu/
)
2007
: 0.00 days (from
http://epp.eurostat.ec.europa.eu/
)
2008
: 0.00 days (from
http://epp.eurostat.ec.europa.eu/
)
2009
: 0.00 days (from
http://epp.eurostat.ec.europa.eu/
)
2010
: 0.00 days (from
http://epp.eurostat.ec.europa.eu/
)
2011
: 0.00 days (from
http://epp.eurostat.ec.europa.eu/
)
2012
: 0.00 days (from
http://epp.eurostat.ec.europa.eu/
)
Days with high O3 concentrations
1999
: 13.00 days (from
http://epp.eurostat.ec.europa.eu/
)
2000
: 6.20 days (from
http://epp.eurostat.ec.europa.eu/
)
2001
: 22.00 days (from
http://epp.eurostat.ec.europa.eu/
)
2002
: 5.83 days (from
http://epp.eurostat.ec.europa.eu/
)
2003
: 29.17 days (from
http://epp.eurostat.ec.europa.eu/
)
2004
: 7.17 days (from
http://epp.eurostat.ec.europa.eu/
)
2005
: 11.80 days (from
http://epp.eurostat.ec.europa.eu/
)
2006
: 20.40 days (from
http://epp.eurostat.ec.europa.eu/
)
2007
: 10.00 days (from
http://epp.eurostat.ec.europa.eu/
)
2008
: 13.00 days (from
http://epp.eurostat.ec.europa.eu/
)
2009
: 6.00 days (from
http://epp.eurostat.ec.europa.eu/
)
2010
: 10.00 days (from
http://epp.eurostat.ec.europa.eu/
)
2011
: 13.00 days (from
http://epp.eurostat.ec.europa.eu/
)
2012
: 8.00 days (from
http://epp.eurostat.ec.europa.eu/
)
Days with high Particulate Matter concentrations (PM10)
2001
: 5.50 days (from
http://epp.eurostat.ec.europa.eu/
)
2002
: 4.00 days (from
http://epp.eurostat.ec.europa.eu/
)
2003
: 6.00 days (from
http://epp.eurostat.ec.europa.eu/
)
2004
: 1.00 days (from
http://epp.eurostat.ec.europa.eu/
)
2005
: 1.33 days (from
http://epp.eurostat.ec.europa.eu/
)
2006
: 4.67 days (from
http://epp.eurostat.ec.europa.eu/
)
2007
: 28.00 days (from
http://epp.eurostat.ec.europa.eu/
)
2008
: 12.00 days (from
http://epp.eurostat.ec.europa.eu/
)
2009
: 23.00 days (from
http://epp.eurostat.ec.europa.eu/
)
2010
: 14.00 days (from
http://epp.eurostat.ec.europa.eu/
)
2011
: 27.00 days (from
http://epp.eurostat.ec.europa.eu/
)
2012
: 22.00 days (from
http://epp.eurostat.ec.europa.eu/
)
Municipal waste (1000 t)
2009
: 299150.33 1000 t (from
http://epp.eurostat.ec.europa.eu/
)
2011
: 294699.60 1000 t (from
http://epp.eurostat.ec.europa.eu/
)
Geography
Latitude
2015
: 49.4412 (from
http://dbpedia.org/
)
Longitude
2015
: 1.0963 (from
http://dbpedia.org/
)
Social Aspects
Apartments
2009
: 132324 no (from
http://epp.eurostat.ec.europa.eu/
)
2010
: 132934 no (from
http://epp.eurostat.ec.europa.eu/
)
2011
: 134408 no (from
http://epp.eurostat.ec.europa.eu/
)
Average area of living
2009
: 42.00 m2 (from
http://epp.eurostat.ec.europa.eu/
)
2010
: 42.00 m2 (from
http://epp.eurostat.ec.europa.eu/
)
2011
: 42.51 m2 (from
http://epp.eurostat.ec.europa.eu/
)
Conventional dwellings
2009
: 236072 Conventional dwellings (from
http://epp.eurostat.ec.europa.eu/
)
2010
: 237478 Conventional dwellings (from
http://epp.eurostat.ec.europa.eu/
)
2011
: 239755 Conventional dwellings (from
http://epp.eurostat.ec.europa.eu/
)
Conventional dwellings
2009
: 236072 no (from
http://epp.eurostat.ec.europa.eu/
)
2010
: 237478 no (from
http://epp.eurostat.ec.europa.eu/
)
2011
: 239755 no (from
http://epp.eurostat.ec.europa.eu/
)
Crude birth rate
2011
: 13.317 persons/1000 inhabitants (from
http://epp.eurostat.ec.europa.eu/
)
Crude death rate
2011
: 8.458 persons/1000 inhabitants (from
http://epp.eurostat.ec.europa.eu/
)
Deaths
2011
: 4120 no (from
http://epp.eurostat.ec.europa.eu/
)
2012
: 4215 no (from
http://epp.eurostat.ec.europa.eu/
)
Deaths <65
2011
: 896 no (from
http://epp.eurostat.ec.europa.eu/
)
2012
: 924 no (from
http://epp.eurostat.ec.europa.eu/
)
Deaths <65 female
2011
: 310 no (from
http://epp.eurostat.ec.europa.eu/
)
2012
: 284 no (from
http://epp.eurostat.ec.europa.eu/
)
Deaths <65 male
2011
: 586 no (from
http://epp.eurostat.ec.europa.eu/
)
2012
: 640 no (from
http://epp.eurostat.ec.europa.eu/
)
Deaths due to circulatory or respiratory systems <65
2010
: 154 no (from
http://epp.eurostat.ec.europa.eu/
)
2011
: 160 no (from
http://epp.eurostat.ec.europa.eu/
)
Deaths female
2011
: 2135 no (from
http://epp.eurostat.ec.europa.eu/
)
2012
: 2103 no (from
http://epp.eurostat.ec.europa.eu/
)
Deaths male
2011
: 1985 no (from
http://epp.eurostat.ec.europa.eu/
)
2012
: 2112 no (from
http://epp.eurostat.ec.europa.eu/
)
Dwellings
2009
: 236072 Conventional dwellings (from
http://epp.eurostat.ec.europa.eu/
)
2010
: 237478 Conventional dwellings (from
http://epp.eurostat.ec.europa.eu/
)
2011
: 239755 Conventional dwellings (from
http://epp.eurostat.ec.europa.eu/
)
Dwellings
2009
: 236072 no (from
http://epp.eurostat.ec.europa.eu/
)
2010
: 237478 no (from
http://epp.eurostat.ec.europa.eu/
)
2011
: 239755 no (from
http://epp.eurostat.ec.europa.eu/
)
Dwellings lacking basic amenities
2009
: 1236 no (from
http://epp.eurostat.ec.europa.eu/
)
2010
: 1203 no (from
http://epp.eurostat.ec.europa.eu/
)
2011
: 1077 no (from
http://epp.eurostat.ec.europa.eu/
)
Empty dwellings
2009
: 14090 no (from
http://epp.eurostat.ec.europa.eu/
)
2010
: 14510 no (from
http://epp.eurostat.ec.europa.eu/
)
2011
: 15045 no (from
http://epp.eurostat.ec.europa.eu/
)
Households apartments
2009
: 120553 no (from
http://epp.eurostat.ec.europa.eu/
)
2010
: 120885 no (from
http://epp.eurostat.ec.europa.eu/
)
2011
: 122143 no (from
http://epp.eurostat.ec.europa.eu/
)
Households houses
2009
: 97639 no (from
http://epp.eurostat.ec.europa.eu/
)
2010
: 98154 no (from
http://epp.eurostat.ec.europa.eu/
)
2011
: 98613 no (from
http://epp.eurostat.ec.europa.eu/
)
Households owning dwelling
2009
: 98971 no (from
http://epp.eurostat.ec.europa.eu/
)
2010
: 99058 no (from
http://epp.eurostat.ec.europa.eu/
)
2011
: 99608 no (from
http://epp.eurostat.ec.europa.eu/
)
Households private rented housing
2009
: 58227 no (from
http://epp.eurostat.ec.europa.eu/
)
2010
: 58490 no (from
http://epp.eurostat.ec.europa.eu/
)
2011
: 58976 no (from
http://epp.eurostat.ec.europa.eu/
)
Households social housing
2009
: 58961 no (from
http://epp.eurostat.ec.europa.eu/
)
2010
: 59678 no (from
http://epp.eurostat.ec.europa.eu/
)
2011
: 60654 no (from
http://epp.eurostat.ec.europa.eu/
)
Houses
2009
: 101821 no (from
http://epp.eurostat.ec.europa.eu/
)
2010
: 102547 no (from
http://epp.eurostat.ec.europa.eu/
)
2011
: 103216 no (from
http://epp.eurostat.ec.europa.eu/
)
Infant mortality rate
2011
: 21 % (from
http://epp.eurostat.ec.europa.eu/
)
2012
: 30 % (from
http://epp.eurostat.ec.europa.eu/
)
Infant mortality rate (per 1000 live births)
2011
: 3.237 persons/1000 live births (from
http://epp.eurostat.ec.europa.eu/
)
2012
: 4.620 persons/1000 live births (from
http://epp.eurostat.ec.europa.eu/
)
Live births
2011
: 6487 no (from
http://epp.eurostat.ec.europa.eu/
)
2012
: 6494 no (from
http://epp.eurostat.ec.europa.eu/
)
Proportion living in apartments
2009
: 54.8 % (from
http://epp.eurostat.ec.europa.eu/
)
2010
: 54.8 % (from
http://epp.eurostat.ec.europa.eu/
)
2011
: 54.9 % (from
http://epp.eurostat.ec.europa.eu/
)
Proportion living in houses
2009
: 44.4 % (from
http://epp.eurostat.ec.europa.eu/
)
2010
: 44.5 % (from
http://epp.eurostat.ec.europa.eu/
)
2011
: 44.3 % (from
http://epp.eurostat.ec.europa.eu/
)
Proportion living in owned dwellings
2009
: 45.0 % (from
http://epp.eurostat.ec.europa.eu/
)
2010
: 44.9 % (from
http://epp.eurostat.ec.europa.eu/
)
2011
: 44.7 % (from
http://epp.eurostat.ec.europa.eu/
)
Training and Education
Children in day care or school
2012
: 12564 persons (from
http://epp.eurostat.ec.europa.eu/
)
Persons 25-64 with medium education
2010
: 112766 persons (from
http://epp.eurostat.ec.europa.eu/
)
2011
: 113237 persons (from
http://epp.eurostat.ec.europa.eu/
)
Persons 25-64 with minor education
2010
: 57249 persons (from
http://epp.eurostat.ec.europa.eu/
)
2011
: 55173 persons (from
http://epp.eurostat.ec.europa.eu/
)
Students higher education
2011
: 38396 persons (from
http://epp.eurostat.ec.europa.eu/
)
2012
: 39772 persons (from
http://epp.eurostat.ec.europa.eu/
)
Students higher education female
2011
: 21028 persons (from
http://epp.eurostat.ec.europa.eu/
)
2012
: 21842 persons (from
http://epp.eurostat.ec.europa.eu/
)
Students higher education male
2011
: 17368 persons (from
http://epp.eurostat.ec.europa.eu/
)
2012
: 17930 persons (from
http://epp.eurostat.ec.europa.eu/
)
Working age persons with higher education
2010
: 71145 % (from
http://epp.eurostat.ec.europa.eu/
)
2011
: 72732 % (from
http://epp.eurostat.ec.europa.eu/
)
Travel and Transport
Cars
2009
: 237074 no (from
http://epp.eurostat.ec.europa.eu/
)
2010
: 238203 no (from
http://epp.eurostat.ec.europa.eu/
)
2011
: 240028 no (from
http://epp.eurostat.ec.europa.eu/
)
Cars per 1000 population
2009
: 487.3 no (from
http://epp.eurostat.ec.europa.eu/
)
2010
: 489.8 no (from
http://epp.eurostat.ec.europa.eu/
)
2011
: 492.7 no (from
http://epp.eurostat.ec.europa.eu/
)
Commute distance
2009
: 17.00 km (from
http://epp.eurostat.ec.europa.eu/
)
2010
: 17.00 km (from
http://epp.eurostat.ec.europa.eu/
)
Commute duration
2009
: 25.00 minutes (from
http://epp.eurostat.ec.europa.eu/
)
2010
: 25.00 minutes (from
http://epp.eurostat.ec.europa.eu/
)
Deaths in road accidents
2008
: 13 no (from
http://epp.eurostat.ec.europa.eu/
)
2009
: 11 no (from
http://epp.eurostat.ec.europa.eu/
)
2010
: 17 no (from
http://epp.eurostat.ec.europa.eu/
)
2011
: 15 no (from
http://epp.eurostat.ec.europa.eu/
)
Incoming commuters
2009
: 170953 persons (from
http://epp.eurostat.ec.europa.eu/
)
2010
: 170537 persons (from
http://epp.eurostat.ec.europa.eu/
)
Outgoing commuters
2009
: 139007 persons (from
http://epp.eurostat.ec.europa.eu/
)
2010
: 138245 persons (from
http://epp.eurostat.ec.europa.eu/
)
People killed in road accidents per 1000 population
2009
: 0.226 persons/10000 persons (from
http://epp.eurostat.ec.europa.eu/
)
2010
: 0.350 persons/10000 persons (from
http://epp.eurostat.ec.europa.eu/
)
2011
: 0.308 persons/10000 persons (from
http://epp.eurostat.ec.europa.eu/
)
Price taxi
2012
: 10.70 EUR (from
http://epp.eurostat.ec.europa.eu/
)
Proportion commute by bicycle
2007
: 2.00 % (from
http://epp.eurostat.ec.europa.eu/
)
Proportion commute by car
2007
: 68.00 % (from
http://epp.eurostat.ec.europa.eu/
)
Proportion commute by car or motor cycle
2007
: 70.00 % (from
http://epp.eurostat.ec.europa.eu/
)
Proportion commute by foot
2007
: 11.00 % (from
http://epp.eurostat.ec.europa.eu/
)
Proportion commute by motor cycle
2007
: 2.00 % (from
http://epp.eurostat.ec.europa.eu/
)
Proportion commute by public transport
2007
: 17.00 % (from
http://epp.eurostat.ec.europa.eu/
)
General
http://dbpedia.org/ontology/area
2.138e+07
http://dbpedia.org/ontology/department
http://dbpedia.org/resource/Seine-Maritime
http://dbpedia.org/ontology/inseeCode
76540
http://dbpedia.org/ontology/intercommunality
http://dbpedia.org/resource/Agglomeration_community_of_Rouen-Elbeuf-Austreberthe
http://dbpedia.org/ontology/mayor
http://dbpedia.org/resource/Yvon_Robert_(mayor)
http://dbpedia.org/ontology/populationTotal
111000
http://dbpedia.org/ontology/region
http://dbpedia.org/resource/Upper_Normandy
http://dbpedia.org/ontology/thumbnail
http://upload.wikimedia.org/wikipedia/commons/thumb/5/53/Rouen_montage.jpg/200px-Rouen_montage.jpg
http://dbpedia.org/property/areaKm
21.38
http://dbpedia.org/property/department
http://dbpedia.org/resource/Seine-Maritime
http://dbpedia.org/property/imageSize
200
http://dbpedia.org/property/insee
76540
http://dbpedia.org/property/intercommunality
http://dbpedia.org/resource/Agglomeration_community_of_Rouen-Elbeuf-Austreberthe
http://dbpedia.org/property/latitude
49.4412
http://dbpedia.org/property/longitude
1.0963
http://dbpedia.org/property/mayor
http://dbpedia.org/resource/Yvon_Robert_(mayor)
http://dbpedia.org/property/metroAreaDate
2010
http://dbpedia.org/property/metroAreaKm
1800
http://dbpedia.org/property/metroAreaPop
650000
http://dbpedia.org/property/metroAreaPopDate
2010
http://dbpedia.org/property/party
http://dbpedia.org/resource/Socialist_Party_(France)
http://dbpedia.org/property/population
111000
http://dbpedia.org/property/populationDate
20067
http://dbpedia.org/property/populationRanking
36
http://dbpedia.org/property/term
2012
http://dbpedia.org/property/urbanAreaKm
448
http://dbpedia.org/property/urbanPop
494382
http://dbpedia.org/property/urbanPopDate
2010
http://www.w3.org/1999/02/22-rdf-syntax-ns#type
http://dbpedia.org/class/yago/Commune108541609
http://dbpedia.org/class/yago/Location100027167
http://dbpedia.org/class/yago/YagoLegalActorGeo
http://dbpedia.org/class/yago/VikingAgePopulatedPlaces
http://dbpedia.org/class/yago/PrefecturesInFrance
http://dbpedia.org/class/yago/Site108651247
http://dbpedia.org/class/yago/GeographicalArea108574314
http://dbpedia.org/class/yago/YagoPermanentlyLocatedEntity
http://dbpedia.org/class/yago/Region108630985
http://dbpedia.org/class/yago/YagoGeoEntity
http://www.w3.org/2002/07/owl#Thing
http://dbpedia.org/class/yago/Object100002684
http://www.opengis.net/gml/_Feature
http://dbpedia.org/class/yago/AdministrativeDistrict108491826
http://dbpedia.org/ontology/Settlement
http://dbpedia.org/class/yago/CommunesOfSeine-Maritime
http://dbpedia.org/class/yago/Tract108673395
http://dbpedia.org/ontology/Place
http://dbpedia.org/class/yago/PhysicalEntity100001930
http://schema.org/Place
http://dbpedia.org/ontology/PopulatedPlace
http://citydata.wu.ac.at/ns#SpatialContext
http://dbpedia.org/class/yago/Prefecture108626947
http://umbel.org/umbel/rc/PopulatedPlace
http://dbpedia.org/class/yago/District108552138
http://citydata.wu.ac.at/ns#City
http://www.w3.org/2000/01/rdf-schema#label
ルーアン
鲁昂
Rouen
Rouen
Rouen
Rouen
Rouen
Rouen
Rouen
Ruan
Руан
Ruão
http://www.w3.org/2003/01/geo/wgs84_pos#lat
49.4412
http://www.w3.org/2003/01/geo/wgs84_pos#long
1.0963
http://www.w3.org/ns/prov#wasDerivedFrom
http://en.wikipedia.org/wiki/Rouen?oldid=546706413
http://xmlns.com/foaf/0.1/depiction
http://upload.wikimedia.org/wikipedia/commons/5/53/Rouen_montage.jpg
http://xmlns.com/foaf/0.1/isPrimaryTopicOf
http://en.wikipedia.org/wiki/Rouen
Country
http://dbpedia.org/resource/France


